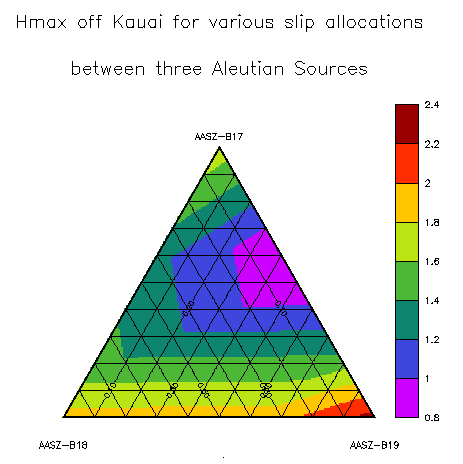
Three correlating data sets can be graphed on a triangular plot, which, as one can assume, is shaped in a triangle. These are not widely used, as it is rare that only three data sets can be graphed in this method. The above example was taken from a science website.
Where example was found: http://www.pmel.noaa.gov/maillists/tmap/ferret_users/fu_2007/jpgCqrZqdDwYG.jpg
No comments:
Post a Comment