Tuesday, August 4, 2009

Post 45: Histogram


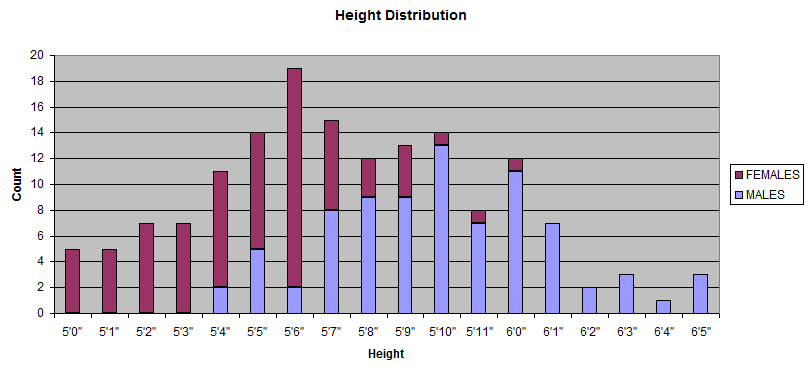
To put it in the simplest form that I can, a histogram is a “graphical display of tabulated frequencies”. In other words, it’s a bar graph that details quantities of an item or an event. It is also another graph that is taught to us early in our educational careers. The one above is a histogram comparing male to female height differences.

Where example was found: http://mindprod.com/image/math/histogram.png

Post 44: Parallel Coordinate Graph


These graphs are often used to determine whether there is a relationship between multiple variables. There is a correlation between the geometric properties of the graph and specific properties of its data. The example that I found is yet another preview from a software ad.

Where example was found: http://bdtnp.lbl.gov/Fly-Net/content/bid/pcx/ParallelCoordinates/ParallelCoordinate_MainGUI.png

Post 43: Triangular Plot


Three correlating data sets can be graphed on a triangular plot, which, as one can assume, is shaped in a triangle. These are not widely used, as it is rare that only three data sets can be graphed in this method. The above example was taken from a science website.

Where example was found: http://www.pmel.noaa.gov/maillists/tmap/ferret_users/fu_2007/jpgCqrZqdDwYG.jpg

Monday, August 3, 2009

Post 42: Wind Rose


Meteorologists use wind roses to represent wind speed and direction in a given location. It uses frequency to accomplish this, and each circle emanating from the center shows an increase in the frequency of winds blowing in that direction. The wind rose above is an example that I found, though I could not identify the location it was made for.

Where example was found: http://www.vistadatavision.com/uploads/images/reports/wind_rose_vector_1.png

Post 41: Climagraph


As you can probably guess from its name, this type of map is used to display temperature and precipitation measurements for an area. A bar graph is typically used to display rain levels, while a line graph shows temperature patterns. The one above shows the measurements of Toronto, Ontario.

Where example was found: http://www.yerich.net/projects/toronto/images/climagraph.png